One dashboard, every provider
AWS, Google Cloud, and Azure accounts sit side by side in a single Cloud Accounts view — each with resource count, open recommendations, dollar savings, sync status, and last-sync time at a glance.
Product · Platform Overview
Multi-cloud visibility, cost intelligence, a conversational AI assistant, and remediation that ships as code — one platform, run continuously across every account you connect.
Read-only accessTerraform-native$0 until savings land
How it works
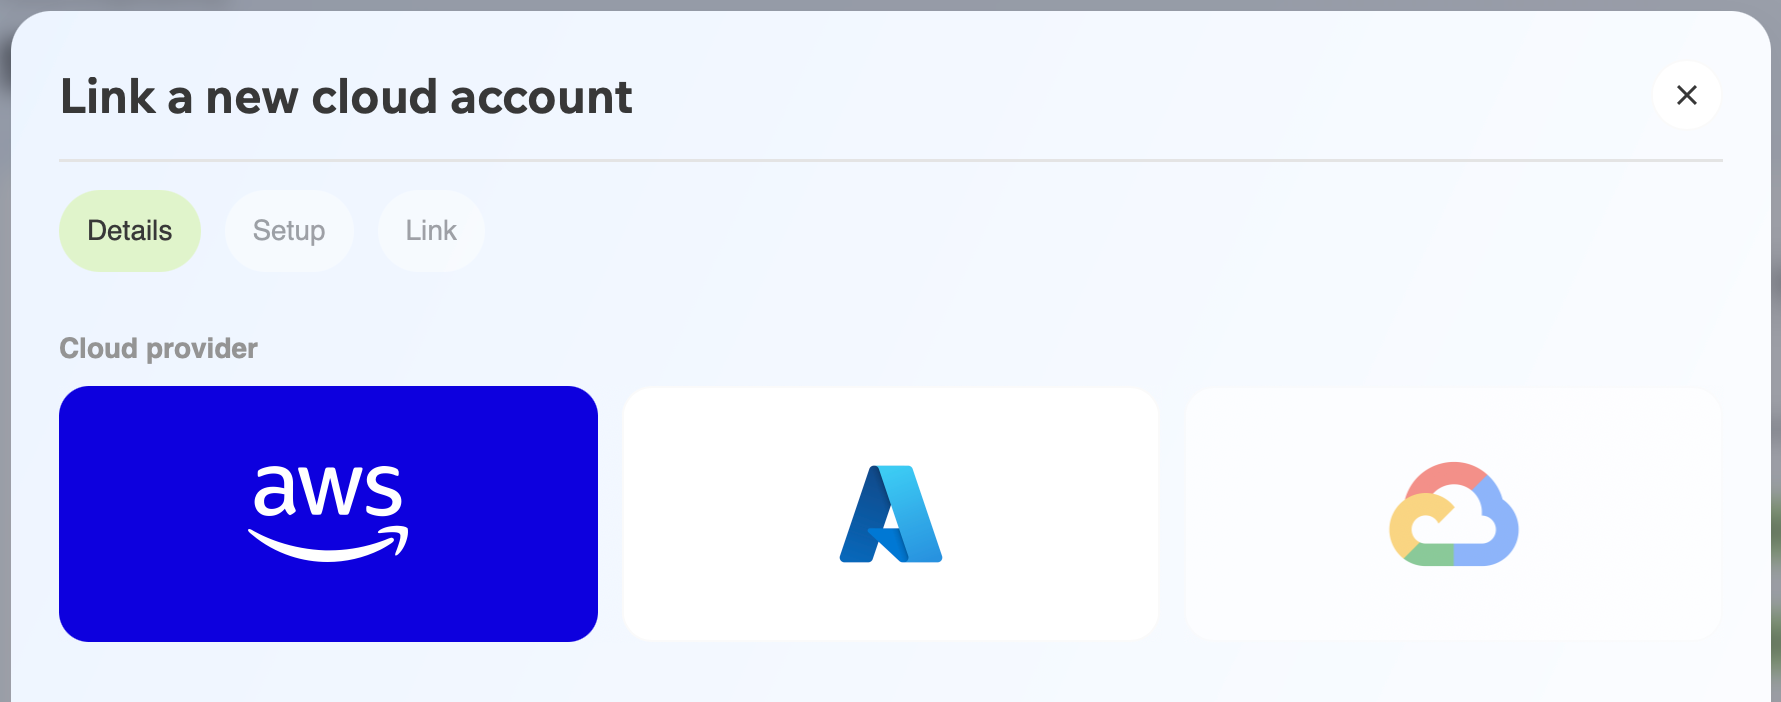
Plug in your AWS, Azure, and GCP accounts with read-only access. Jetscale never writes to your cloud — nothing changes without your team's review.
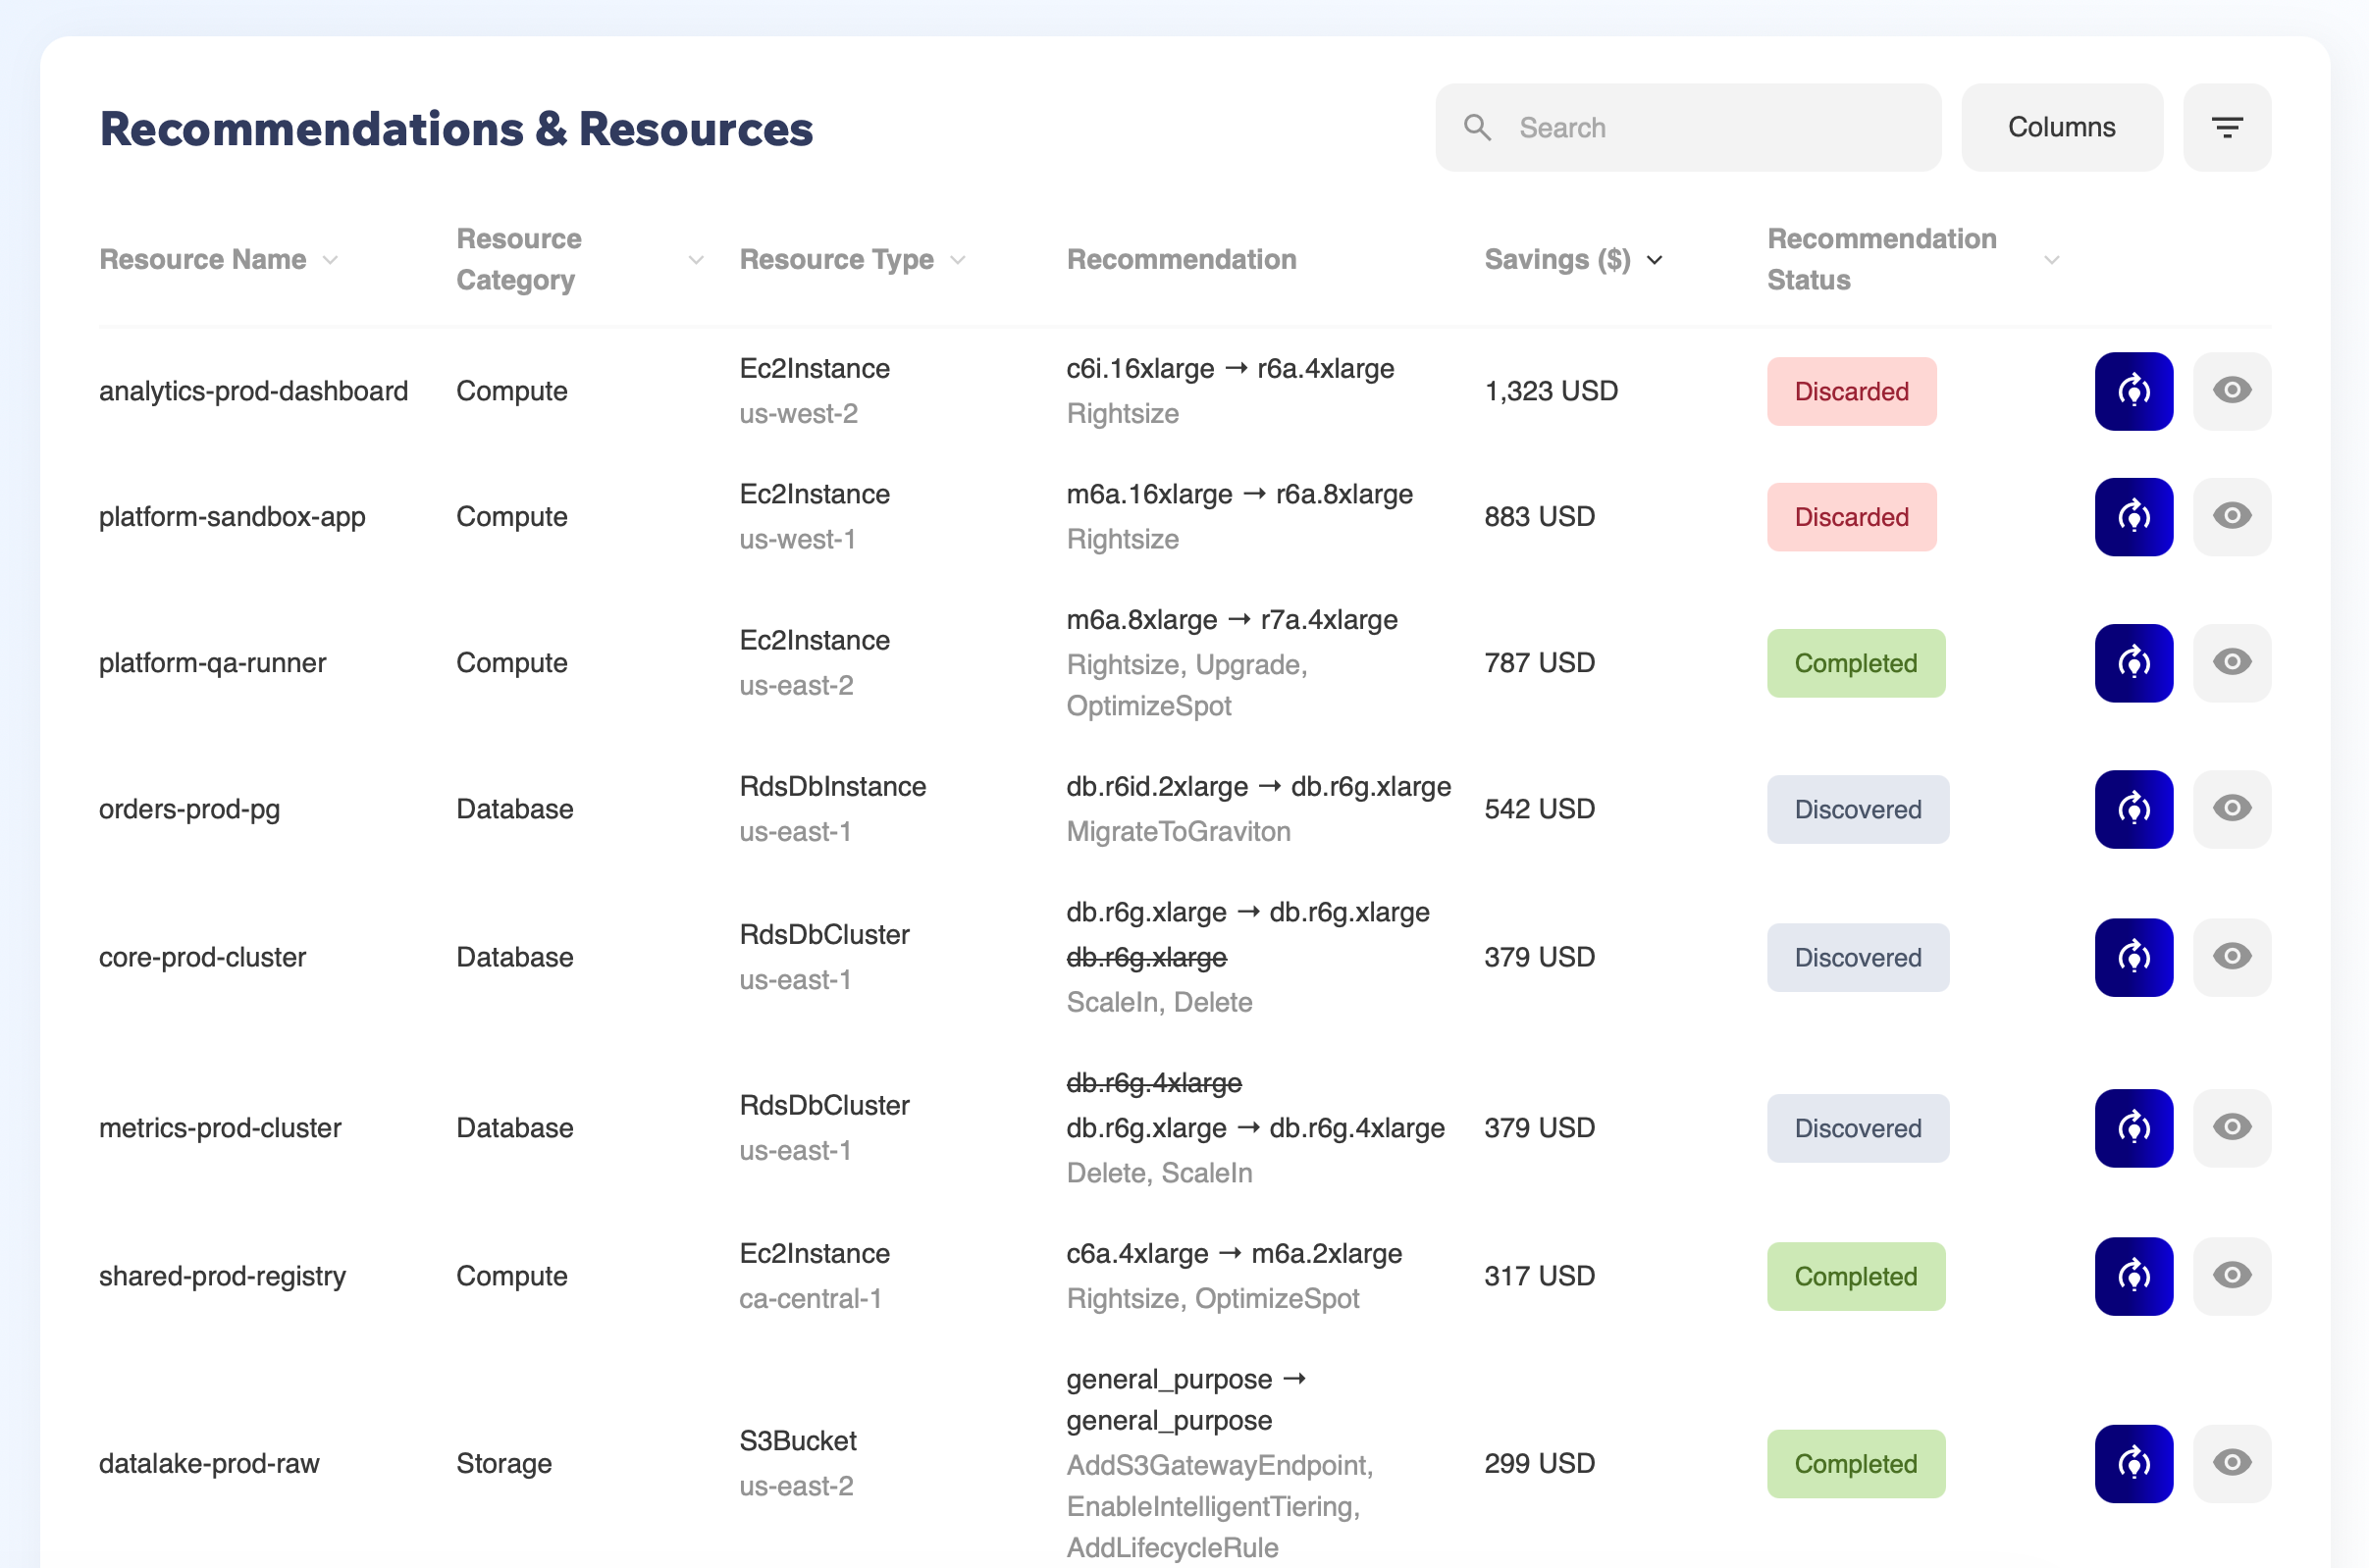
The Analyzer Agent scans your footprint and ranks every opportunity with evidence: telemetry, configuration data, and business context. Findings, not hunches.
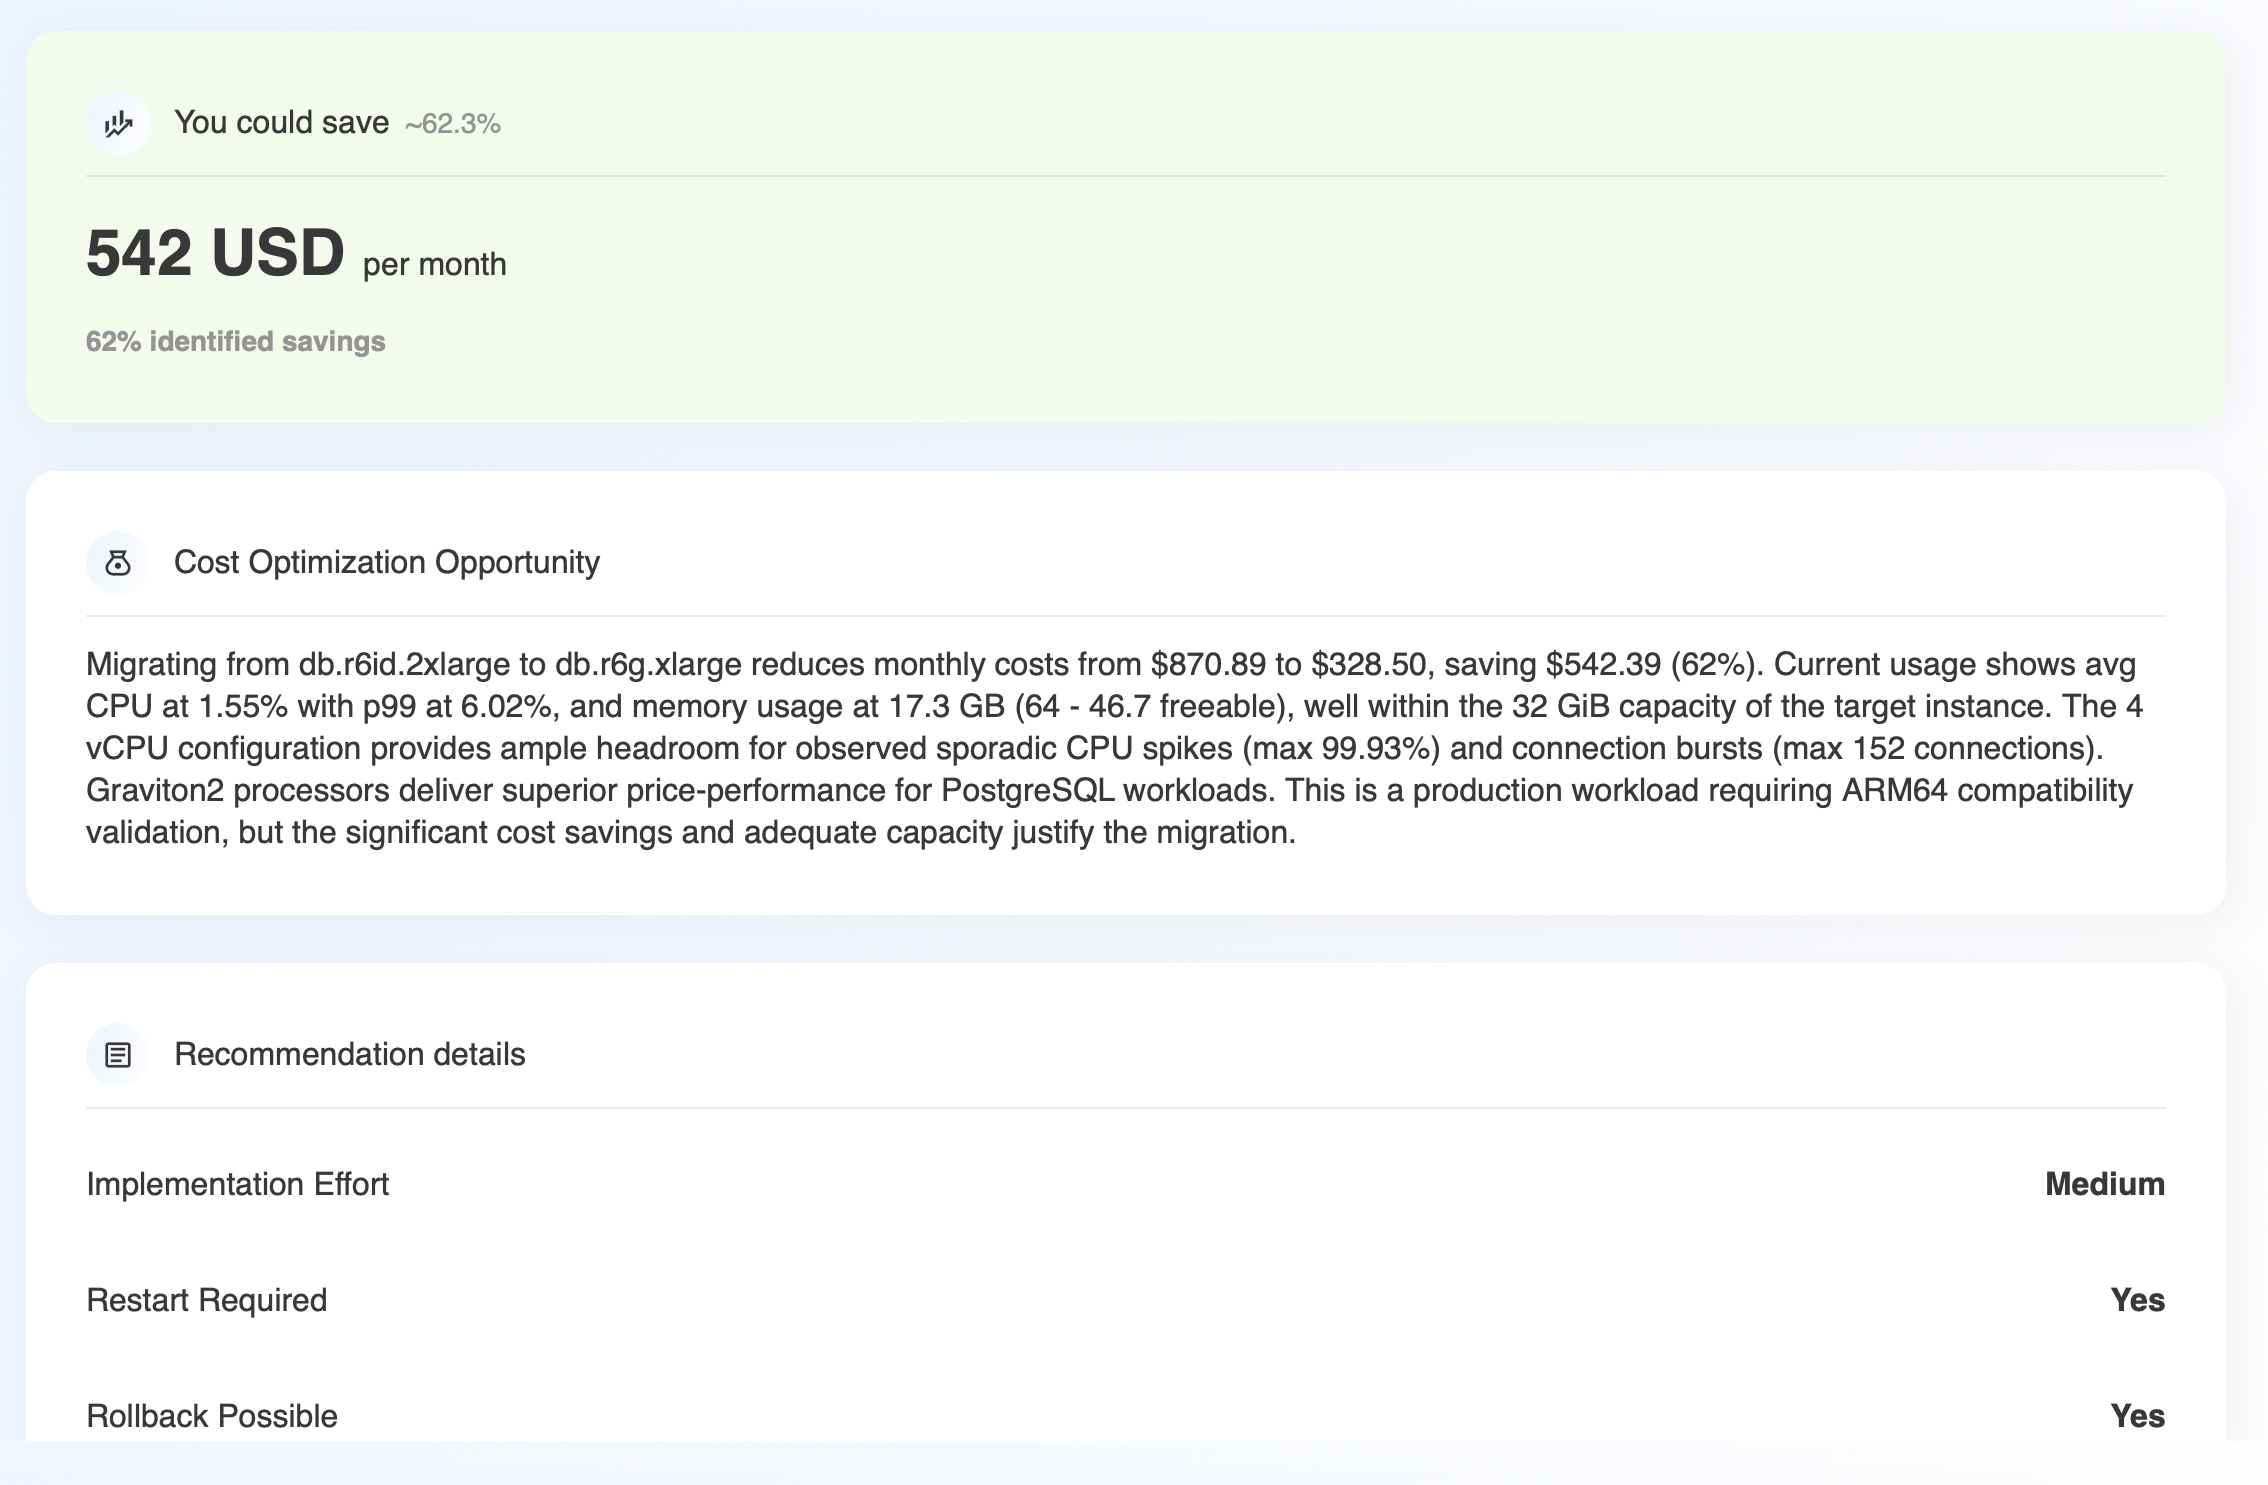
Each finding becomes a structured plan — what changes, expected impact, safest rollout path — delivered as a PR-ready Terraform diff or a guided ClickOps runbook with exact console URLs. Review, merge, deploy. Like any other change.
Multi-cloud visibility
Cloud accounts, wherever they live, roll up into a single place your team actually checks.
AWS, Google Cloud, and Azure accounts sit side by side in a single Cloud Accounts view — each with resource count, open recommendations, dollar savings, sync status, and last-sync time at a glance.
Onboarding another account is a guided "Link a new cloud account" flow inside the platform — no separate setup project, no waiting on a different team.
Accounts are grouped under business units — e.g. "Cloud Engineering" — with the ability to switch between units and configure each one's name, description, and owner. Built for companies running cloud across more than one team.
Cost intelligence
From a single top-line number down to one line item on one invoice — the same platform, not a different tool.
Cloud spend, projected monthly savings, open recommendations, optimization coverage, governance gaps, and critical performance issues — together on one overview screen.
Savings break into Realized, Open, Deferred, and Discarded, with a realization-rate metric and a week-by-week trend — so "savings identified" and "savings banked" are never confused.
Aggregate cost by service, usage type, or a custom dimension, over any date range, with an interactive donut chart and a sortable table underneath.
A visual breakdown of resources and spend/savings by category — Compute, Storage, Database, Analytics, Monitoring, Security, and more — for when you need the shape of the bill, not just the total.
Ask Jetscale AI
Ask a question in plain English and get an answer synthesized from your actual resources — not a generic support article.
Ask questions like "why is this resource at critical risk?" and get a synthesized, resource-aware answer — no dashboard-spelunking required.
Switch the assistant's perspective — SRE and other roles — so the answer is framed around what that role actually needs to decide next.
Answers include a structured risk-factor table — finding paired with recommended remediation — plus deep links straight to the resource detail page behind it.
Every conversation is saved, so a root-cause thread from last week is still there to revisit, not gone the moment you close the tab.
Remediation & DevOps
A recommendation isn't done when it's found — it's done when it's merged. This is how it gets there.
Guided remediation sessions give you a dedicated workspace to review, discuss, and act on a specific recommendation — including an interactive assistant to answer follow-up questions before you commit to a change.
Native GitOps integrations connect GitHub and Azure DevOps so cost-optimization changes push directly to a repository as code — landing in the CI/CD and change-management process you already run, not a new one.
Explore the platform
Platform Overview is the map. Each area below has its own page with the specifics.
Rightsizing, storage tiering, idle resources, and network paths — found automatically and ranked by impact.
Learn more →Illustrative concept for per-team AI spend attribution, model fit, and context-window tuning.
Planned · not currently availableEC2/EBS rightsizing, S3 lifecycle tiering, Spot via OptimizeSpot, and VPC endpoint gaps.
Learn more →VM and managed disk rightsizing, Blob tiering, and Reserved Instance alignment.
Learn more →Compute Engine and persistent disk rightsizing, GKE tuning, and committed use discounts.
Learn more →Give your own agents and IDE direct access to Jetscale's findings and fixes over the Model Context Protocol.
Learn more →Terraform, GitHub, and your cloud console — fixes ship through the tools you already use.
Learn more →Read-only design, least-privilege roles, and a full audit trail for every recommendation and merge.
Learn more →FAQ
Multi-cloud visibility across every connected AWS, Azure, and GCP account, cost-intelligence dashboards, Ask Jetscale AI for conversational Q&A about your environment, and a Fix Engine that ships changes as GitHub or Azure DevOps pull requests. The Analyzer Agent’s evidence-backed waste detection lives on the Cloud waste page, and security posture on the Security & access page.
Jetscale doesn't stop at reporting. It turns opportunities into Terraform-ready remediation changes your team implements through normal engineering workflows.
No. Jetscale is read-only in your cloud environment. It generates reviewable, fix-ready IaC your team merges and deploys through your existing workflow.
Every plan is pre-verified before it's recommended. OptimizeSpot simulates eviction risk against your actual workloads, and every fix ships as reviewable code with a structured plan, so your team validates scope and confirms impact after rollout. No blind changes.
Outcome-based. Savings are verified against your actual bill, and you’re only charged when they land. No savings, no invoice. See Pricing for plan details.
Get started
Read-only connection. Evidence-backed findings. PR-ready fixes. Invoiced only when savings land.


